Atomic Structure & Radioactive Decay
Unstable nuclei reach stability by emitting particles or photons. Nuclear medicine images the photons — γ-rays from isomeric transition/electron capture, and the 511 keV annihilation photons from β⁺ (positron) emitters. Decay is exponential, characterised by the half-life, and activity is measured in becquerels (SI) or curies.
A nuclide is defined by its protons (Z) and neutrons (N); the neutron-to-proton ratio determines stability and the decay pathway. Diagnostic tracers use γ or β⁺ emitters (imaged), while β⁻ and α emitters are used for therapy (short range, high local dose).
- λ = ln2/T½ = 0.693/T½; mean life τ = 1/λ = 1.443·T½ (activity falls to 37% in one mean life).
- Ten half-lives leave 2⁻¹⁰ ≈ 0.1% of the activity.
- 1 Bq = 1 decay/s; 1 Ci = 3.7×10¹⁰ Bq = 37 GBq; 1 mCi = 37 MBq.
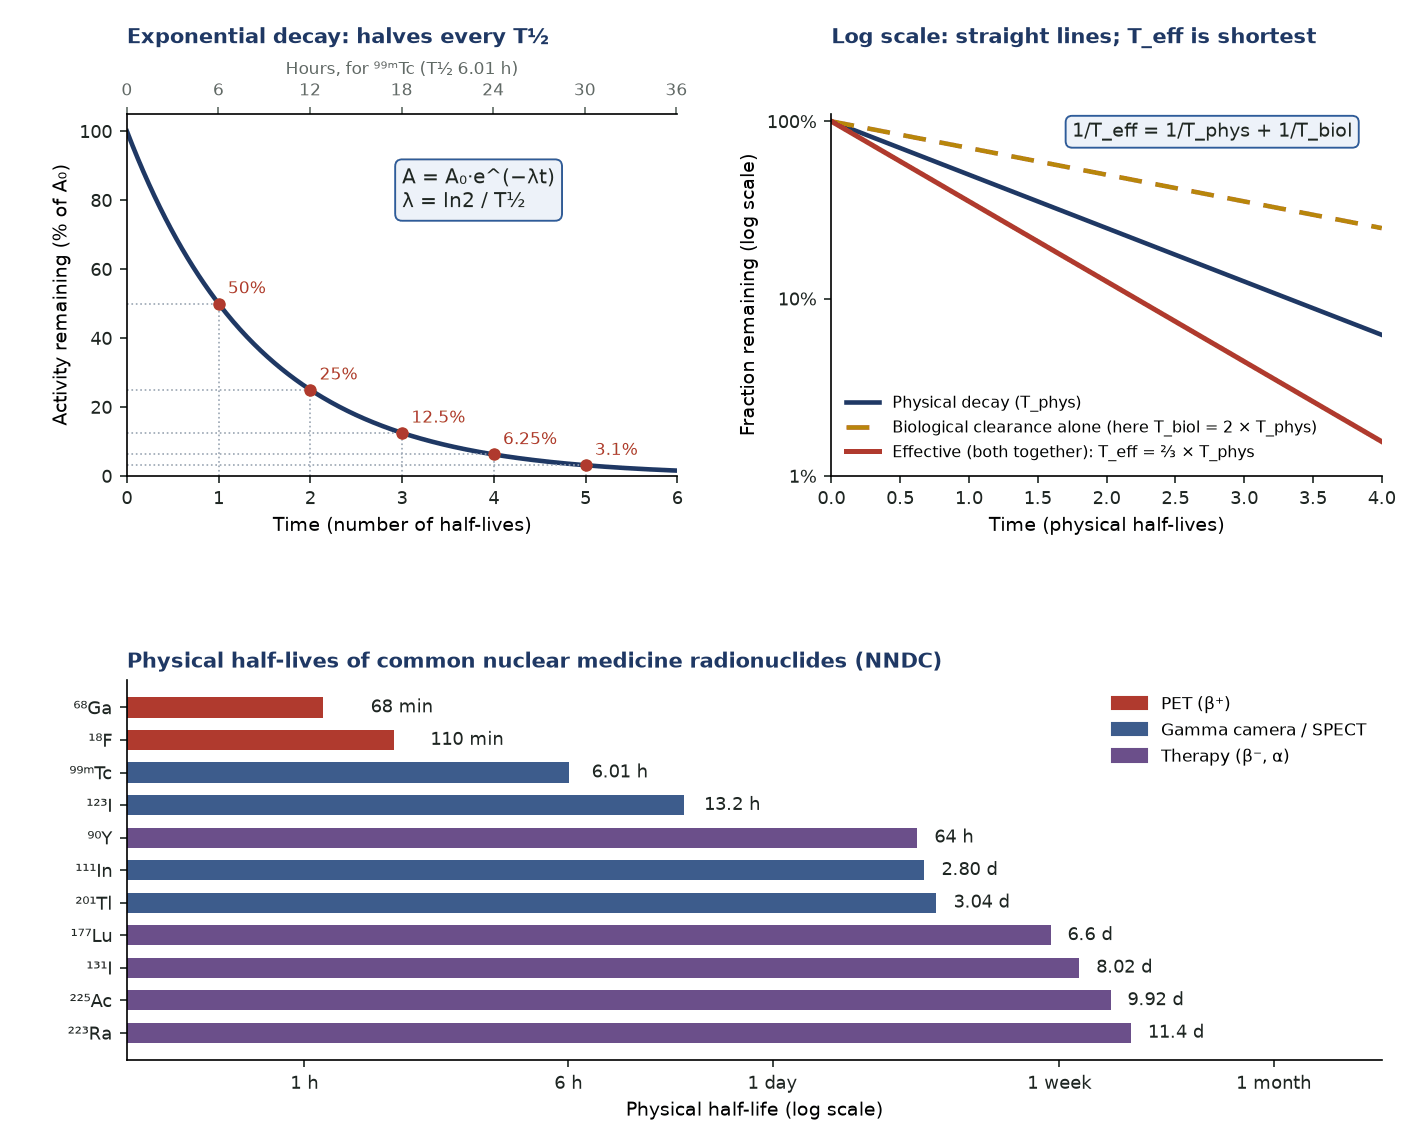
- Half-lives (NNDC, rounded): ⁹⁹ᵐTc 6.01 h, ¹⁸F 110 min, ⁶⁸Ga 68 min, ¹²³I 13.2 h, ¹³¹I 8.02 d, ¹¹¹In 2.80 d, ²⁰¹Tl 3.04 d, ¹⁷⁷Lu 6.65 d, ⁹⁰Y 64.1 h, ²²³Ra 11.4 d.
- β⁺ decay needs a parent–daughter atomic mass difference of at least 1.022 MeV (2 × 511 keV); below that only electron capture occurs.
- ⁹⁹ᵐTc: 140.5 keV γ in 89% of decays; carrier-free specific activity 1.95×10¹⁴ Bq/mg (5.27×10⁶ mCi/mg).
- Mean β energy is about ⅓ E_max for β⁻ (¹³¹I 182 keV; main branch E_max 606 keV) and about 0.4 E_max for β⁺ (¹⁸F 250 of 634 keV).
- K-shell binding energy rises with Z: Tc 21.0 keV, I 33.2 keV, Pb 88.0 keV.
Decaying ⁹⁹ᵐTc activity forward and back
Given. 5.55 GBq (150 mCi) ⁹⁹ᵐTc at 10:00; T½ = 6.01 h. Find the activity 4 h earlier and 5 h later.
- λ = 0.693/6.01 = 0.1153 h⁻¹.
- Earlier (× e^(+λt)): 5.55 × e^(0.461) = 5.55 × 1.586 = 8.80 GBq.
- Later (× e^(−λt)): 5.55 × e^(−0.577) = 5.55 × 0.562 = 3.12 GBq.
Answer. 8.8 GBq (238 mCi) at 06:00; 3.1 GBq (84 mCi) at 15:00.
Effective half-life and residence
Given. 400 MBq of a ⁹⁹ᵐTc agent (T_phys 6.0 h) taken up instantly and cleared with T_biol 12 h.
- T_eff = T_phys·T_biol/(T_phys + T_biol) = 6 × 12/18 = 4.0 h.
- At 24 h: 2^(−24/4) = 1/64 = 1.6% remains (physical decay alone would leave 2^(−4) = 6.3%).
- Time-integrated activity à = 1.443 × A₀ × T_eff = 1.443 × 400 × 4 = 2 309 MBq·h.
Answer. T_eff = 4 h; 1.6% left at 24 h; Ã ≈ 2 310 MBq·h, the quantity multiplied by S-values in MIRD dosimetry.
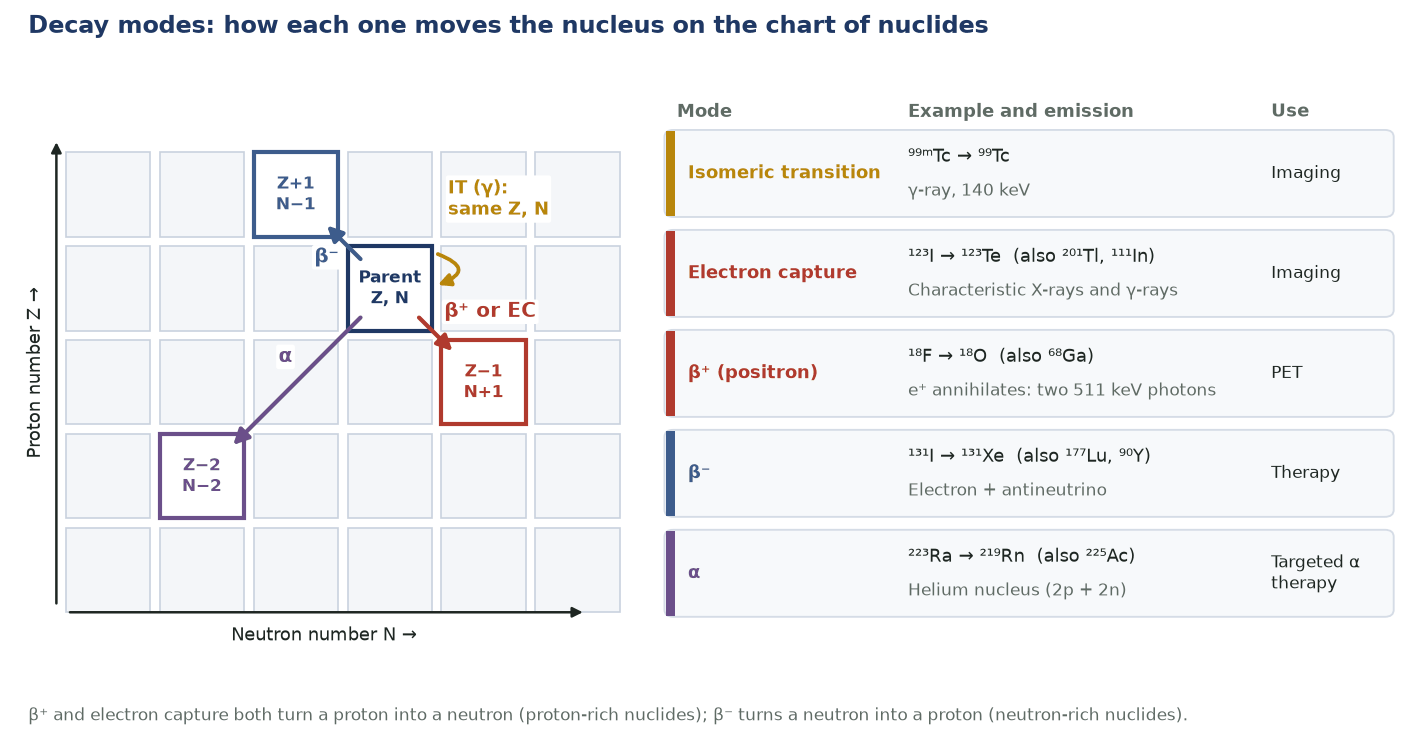
Decay modes
| Mode | Emission | Use |
|---|---|---|
| Isomeric transition | γ-ray (e.g. ⁹⁹ᵐTc 140 keV) | Imaging |
| Electron capture | Characteristic X-rays and γ-rays (¹²³I, ²⁰¹Tl, ¹¹¹In) | Imaging |
| β⁺ (positron) | Two 511 keV annihilation photons (¹⁸F, ⁶⁸Ga) | PET imaging |
| β⁻ | Electron + antineutrino (¹³¹I, ¹⁷⁷Lu, ⁹⁰Y) | Therapy |
| α | Helium nucleus (²²⁵Ac, ²²³Ra) | Targeted α therapy |
Half-life & activity
- Decay is exponential: A = A₀·e^(−λt), with λ = ln2 / T½.
- Physical half-life is fixed; biological half-life reflects excretion; effective half-life combines them: 1/T_eff = 1/T_phys + 1/T_biol.
- Activity units: 1 Bq = 1 decay/s; 1 Ci = 3.7×10¹⁰ Bq; 1 mCi = 37 MBq.
- An ideal diagnostic radionuclide has a half-life comparable to the study, γ emission of about 100–200 keV and no particulate emission.
Why ⁹⁹ᵐTc dominates
- 140 keV γ-ray (89% of decays) with no β⁻ or β⁺ emission: well matched to NaI detection and gives a low patient dose.
- 6-hour half-life balances image quality against radiation burden.
- Generator-produced (⁹⁹Mo/⁹⁹ᵐTc) with versatile cold-kit chemistry; used in about 80% of diagnostic procedures.
Pitfalls
- Longer-lived or higher-energy radionuclidic impurities (e.g. ⁹⁹Mo in ⁹⁹ᵐTc eluate, ¹²⁴I in cyclotron ¹²³I) add patient dose and degrade images through septal penetration.
- Particulate (β/α) emissions deliver dose without contributing to the image.
- Confusing physical with effective half-life over- or under-estimates residence time and absorbed dose.
In the clinic — why the physics matters
- Internal conversion steals imageable photons — for ⁹⁹ᵐTc (α_T ≈ 0.11) only ~90% of transitions yield a 140-keV γ.
- Two 511-keV photons at 180° are the physical basis of PET coincidence detection.
- Effective half-life (not physical) governs how long a tracer actually delivers dose: 1/T_eff = 1/T_phys + 1/T_biol.
- ⁹⁹Mo (66 h) → ⁹⁹ᵐTc (6 h) transient equilibrium is what makes the generator work; daughter peaks ~23 h after elution.
Modes of radioactive decay
| Mode | Nuclear change | ΔZ | ΔA | Example / note |
|---|---|---|---|---|
| Alpha | emits He nucleus | −2 | −4 | ²²³Ra; range in tissue <0.1 mm (a few cell diameters) |
| β⁻ | n → p + β⁻ + ν̄ | +1 | 0 | ¹³¹I → ¹³¹Xe; continuous spectrum, mean ≈ ⅓ E_max |
| β⁺ | p → n + β⁺ + ν | −1 | 0 | needs ≥1.022 MeV; ¹⁸F, ⁶⁸Ga |
| Electron capture | p + e⁻ → n + ν | −1 | 0 | ¹¹¹In, ¹²³I, ²⁰¹Tl; characteristic X-rays and Auger electrons |
| Isomeric transition | excited → lower nuclear state | 0 | 0 | ⁹⁹ᵐTc → ⁹⁹Tc, 140 keV |
Common pitfalls & misconceptions
- Physical ≠ effective ≠ biological half-life — effective is always shorter than the shorter of the other two.
- Mean life ≠ half-life: τ = 1.44·T½, so it's longer, not equal.
- A β⁻ particle comes from the nucleus (n→p), not from the orbital shells.
- β⁻ particles don't all carry E_max — the spectrum is continuous, averaging ~⅓ E_max.
In depth
- Transient equilibrium (T_parent > T_daughter): after several daughter half-lives A_d/A_p = BR·λ_d/(λ_d − λ_p). For ⁹⁹Mo/⁹⁹ᵐTc, 1.10 × 0.87 ≈ 0.96, and daughter activity peaks at t_max = ln(λ_d/λ_p)/(λ_d − λ_p) ≈ 23 h after elution.
- Secular equilibrium (T_parent ≫ T_daughter): A_d ≈ A_p, as in the ⁶⁸Ge/⁶⁸Ga (271 d/68 min) and ⁸²Sr/⁸²Rb (25.3 d/75 s) generators.
- Carrier-free specific activity = λNA/A, so it rises as half-life falls: ¹⁸F reaches about 63 TBq/µmol. Tracer masses are therefore nanomolar or less and have no pharmacological effect.
- Internal conversion transfers the nuclear energy to an orbital electron instead of a γ-ray (conversion coefficient α = e⁻/γ). For the 140 keV ⁹⁹ᵐTc transition α ≈ 0.1, so about 89% of decays give an imageable photon; conversion and Auger electrons add local dose.
- β⁺ and electron capture compete: ¹⁸F is 96.9% β⁺ and ⁶⁸Ga 88.9% β⁺. The positron fraction must be applied whenever PET counts are converted to activity.
- ⁶⁸Ga positrons (E_max 1.90 MeV) have a mean range in water of 3.5 mm against 0.6 mm for ¹⁸F (E_max 0.63 MeV), and 13% of ⁸²Rb positrons are accompanied by a 777 keV prompt γ.
- ²⁰¹Tl is imaged mainly through mercury K X-rays of 69–83 keV emitted after electron capture; its 135 keV and 167 keV γ-rays are much less abundant (about 3% and 10%).
- ⁹⁰Y β⁻ particles (E_max 2.28 MeV) penetrate up to about 11 mm of tissue (mean about 2.5 mm), whereas ²²³Ra α particles travel less than 0.1 mm: range sets the scale of cross-fire and dose heterogeneity.
Sources: Cherry, Sorenson & Phelps, 4th ed. (2012) · NNDC NuDat 3 decay data · ICRP 107 (2008) · Conti & Eriksson, EJNMMI Phys 2016 (PMID 27271304) · ⁹⁰Y microsphere and ²²³Ra product information
Sources
- Cherry SR, Sorenson JA, Phelps ME. Physics in Nuclear Medicine. 4th ed. Philadelphia: Elsevier Saunders; 2012.
- Saha GB. Physics and Radiobiology of Nuclear Medicine. 4th ed. New York: Springer; 2013.
- Bushberg JT, Seibert JA, Leidholdt EM Jr, Boone JM. The Essential Physics of Medical Imaging. 4th ed. Philadelphia: Wolters Kluwer; 2021.
- National Nuclear Data Center, Brookhaven National Laboratory. NuDat 3: evaluated nuclear structure and decay data.
- ICRP. Nuclear decay data for dosimetric calculations. ICRP Publication 107. Ann ICRP. 2008;38(3).
- Conti M, Eriksson L. Physics of pure and non-pure positron emitters for PET: a review and a discussion. EJNMMI Phys. 2016;3:8.