PET & PET/CT Physics
A positron annihilates with an electron to produce two 511 keV photons emitted ~180° apart. PET detects these in coincidence along a line of response, giving high sensitivity and true 3-D quantification without a collimator. Modern scanners use fast LSO/LYSO scintillators, time-of-flight and CT-based attenuation correction; spatial resolution is ~4–5 mm.
Electronic collimation (coincidence detection) replaces the lead collimator, so PET is far more sensitive than SPECT. Positron range and photon non-collinearity set the fundamental physical resolution limit, although detector crystal size dominates on clinical scanners.
- Two 511 keV photons emitted about 180° apart; energy window typically about 425–650 keV on current LSO/LYSO systems.
- Coincidence timing window a few nanoseconds; randoms rate R = 2τ·S₁·S₂, so randoms rise with activity squared.
- Mean positron range in water: ¹⁸F 0.6 mm, ⁶⁸Ga 3.5 mm, ⁸²Rb 7.1 mm (main branch).
- Non-collinearity (±0.25°) blurs by about 0.0022 × ring diameter: ~1.8 mm for an 80 cm ring.
- Clinical scanners: about 3.5–5 mm FWHM near the centre, worsening radially (parallax).
- NEMA scatter fraction of current 3-D scanners roughly 30–40%, higher in large patients.
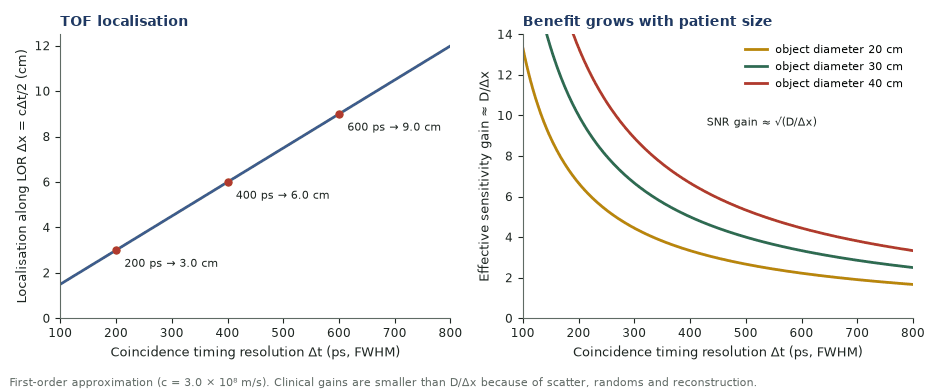
- TOF: Δx = cΔt/2 (400 ps → 6 cm); effective sensitivity gain ≈ D/Δx, SNR gain ≈ √(D/Δx).
- LSO/LYSO: decay about 40 ns, about 30 photons/keV; BGO: 300 ns, about 6 photons/keV, slightly higher stopping power.
Combining PET resolution terms
Given. Detector element width d, non-collinearity term 0.0022D, positron range r, block decoding error b.
- Independent blurs add in quadrature.
- R ≈ 1.25·√((d/2)² + (0.0022D)² + r² + b²) (Moses 2011).
- The positron-range term is small for ¹⁸F (mean 0.6 mm) but significant for ⁸²Rb (7.1 mm).
Answer. ⁸²Rb images are inherently blurrier than ¹⁸F images on the same scanner; detector size dominates for ¹⁸F.
TOF gain for a large patient
Given. 40 cm patient, coincidence timing resolution Δt = 600 ps.
- Δx = cΔt/2 = (30 cm/ns × 0.6 ns)/2 = 9 cm.
- Effective sensitivity gain ≈ D/Δx = 40/9 = 4.4.
- SNR gain ≈ √4.4 = 2.1.
Answer. About 4.4-fold effective sensitivity, about 2.1-fold SNR: TOF helps most in large patients.
Detection
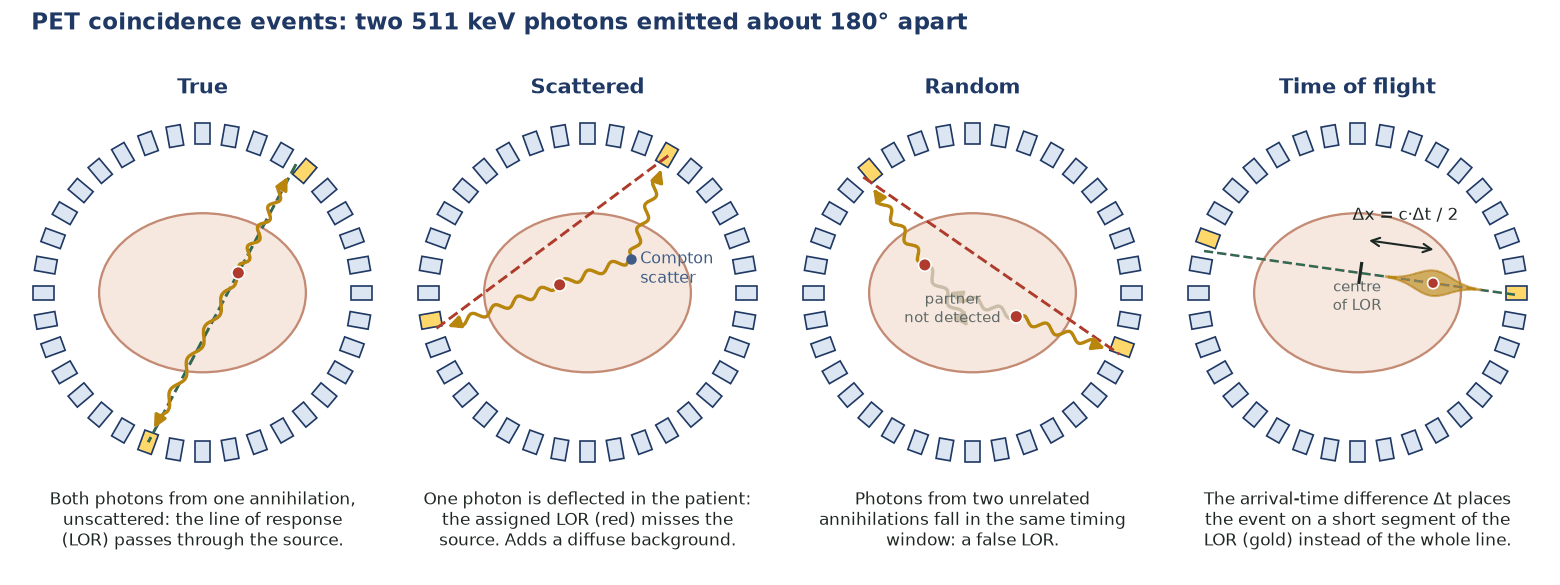
- Two 511 keV photons detected within a narrow timing window define a coincidence event on a line of response.
- Events are true, scattered or random (accidental) — scatter and randoms are estimated and subtracted.
- Scintillators: LSO/LYSO (fast ~40 ns decay, high light output) enable time-of-flight; BGO has slightly higher stopping power but a slow ~300 ns decay and is still used in some current systems; block detectors with many small crystals.
Time-of-flight & 3-D
- TOF measures the small arrival-time difference to localise the annihilation along the LOR, improving signal-to-noise.
- 3-D acquisition (no septa) maximises sensitivity; total-body PET extends the axial field enormously.
- CT provides fast attenuation correction and localisation.
Resolution & quantification
- System resolution is limited by detector crystal size, positron range (larger for ⁶⁸Ga than ¹⁸F) and 511 keV photon non-collinearity → ~4–5 mm.
- Quantitative accuracy enables SUV, dosimetry and kinetic modelling.
- Detector normalisation and cross-calibration keep SUV accurate.
Pitfalls
- Hyperglycaemia, uptake-time variation and body habitus alter SUV (see Quantification).
- CT-based AC errors from contrast, metal, motion and truncation.
- Respiratory motion blurs lung/upper-abdomen lesions — gating helps.
In the clinic — why the physics matters
- TOF improves image quality most in large patients because the gain scales with the diameter D.
- CT attenuation correction is fast and nearly noiseless, whereas older ⁶⁸Ge rod transmission scans added several minutes per bed position and noise.
- 3-D acquisition raises sensitivity but makes accurate scatter and randoms correction essential.
- LSO/LYSO are preferred over BGO in TOF systems because their fast decay allows sub-nanosecond timing and high count rates.
PET scintillators
| Crystal | Z_eff | Density (g/cm³) | Decay (ns) | Light (photons/keV) | Note |
|---|---|---|---|---|---|
| NaI(Tl) | 51 | 3.67 | 230 | 38 | Low stopping power at 511 keV; hygroscopic |
| BGO | 74 | 7.13 | 300 | ~6 | High stopping power; slow; limited TOF |
| LSO | 66 | 7.40 | 40 | ~29 | Fast, bright, dense; contains ¹⁷⁶Lu |
| LYSO | ~65 | 7.1–7.2 | ~40 | ~30 | Similar to LSO; TOF-capable |
Common pitfalls & misconceptions
- Randoms aren't linear with activity — they rise as activity² (R_c = 2τ·R₁·R₂).
- Prompt coincidences aren't all 'true' — they include scatter and randoms, both subtracted before quantification.
- Bigger detectors aren't simply better — larger elements raise sensitivity but degrade resolution and radial elongation.
- PET resolution isn't uniform — it's best at the FOV centre and worsens peripherally (parallax).
In depth
- Prompt coincidences = trues + scatter + randoms. Randoms are estimated with a delayed timing window or from singles rates (R = 2τS₁S₂); scatter by single-scatter simulation scaled to the tails of the sinogram.
- Noise-equivalent count rate NECR = T²/(T + S + kR), with k = 1 or 2 depending on the randoms estimate. NEMA NU 2 measures its peak with a 70 cm long, 20 cm diameter polyethylene phantom and an off-axis line source.
- NEMA NU 2-2018 tests: spatial resolution (point sources, FBP), scatter fraction, count losses and randoms, sensitivity (70 cm line source in nested aluminium sleeves, extrapolated to zero wall), accuracy of corrections, image quality (NEMA IEC body phantom, spheres 10–37 mm, lung insert), TOF resolution and PET/CT co-registration.
- Resolution estimate R ≈ 1.25√((d/2)² + (0.0022D)² + r² + b²): with 4 mm crystals, D = 80 cm and ¹⁸F, the crystal and non-collinearity terms dominate (Moses 2011).
- Positron range is a small effect for ¹⁸F on 4 mm whole-body scanners but measurable for ⁶⁸Ga and ⁸²Rb, and positrons travel further in lung than in soft tissue.
- Prompt γ-rays in coincidence with the positron (⁶⁸Ga 1.2% with 1.077 MeV; ⁸²Rb 13.1% with 777 keV; ¹²⁴I 603 keV) create spurious coincidences that need prompt-gamma correction; ⁹⁰Y PET relies on a 32 ppm pair branch and must count for long.
- LSO and LYSO contain ¹⁷⁶Lu (2.6% of natural lutetium), a β⁻ emitter with 307, 202 and 88 keV γ-rays; this intrinsic background matters only at very low count rates such as ⁹⁰Y imaging.
- Quantitative QC (AAPM TG-126): a uniform phantom should give SUV 1.0 within 0.90–1.10; follow-up resolution and sensitivity within ±5% of baseline; PET/CT registration within 1 voxel. EANM advises cross-calibration with the dose calibrator at least quarterly.
Sources: NEMA NU 2-2018 · AAPM Report 126 (2019) · Moses, Nucl Instrum Methods A 2011 · Conti & Eriksson 2016 (PMID 27271304) · Surti & Karp 2016 (PMID 26778577) · EANM FDG guideline 2015 (PMID 25452219)
Sources
- Cherry SR, Sorenson JA, Phelps ME. Physics in Nuclear Medicine. 4th ed. Philadelphia: Elsevier Saunders; 2012.
- National Electrical Manufacturers Association. NEMA NU 2-2018: Performance measurements of positron emission tomographs. Rosslyn, VA: NEMA; 2018.
- Mawlawi OR, Kemp BJ, Jordan DW, et al. AAPM Report No. 126: PET/CT acceptance testing and quality assurance. College Park, MD: AAPM; 2019.
- Moses WW. Fundamental limits of spatial resolution in PET. Nucl Instrum Methods Phys Res A. 2011;648(Suppl 1):S236-40.
- Conti M, Eriksson L. Physics of pure and non-pure positron emitters for PET: a review and a discussion. EJNMMI Phys. 2016;3:8.
- Surti S, Karp JS. Advances in time-of-flight PET. Phys Med. 2016;32:12-22.
- Boellaard R, Delgado-Bolton R, Oyen WJ, et al. FDG PET/CT: EANM procedure guidelines for tumour imaging: version 2.0. Eur J Nucl Med Mol Imaging. 2015;42:328-54.
- International Atomic Energy Agency. Quality Assurance for PET and PET/CT Systems. IAEA Human Health Series No. 1. Vienna: IAEA; 2009.