Counting Statistics & the Dose Calibrator
Radioactive decay is random, so every count carries an uncertainty set only by how many counts were collected: σ = √N. The dose calibrator, a pressurised re-entrant ionisation chamber, measures every administered activity and must be accurate, linear and set correctly for each nuclide and container.
Counters (well counters, uptake probes, gamma cameras) record individual events; the dose calibrator integrates an ionisation current. Both belong in routine quality control.
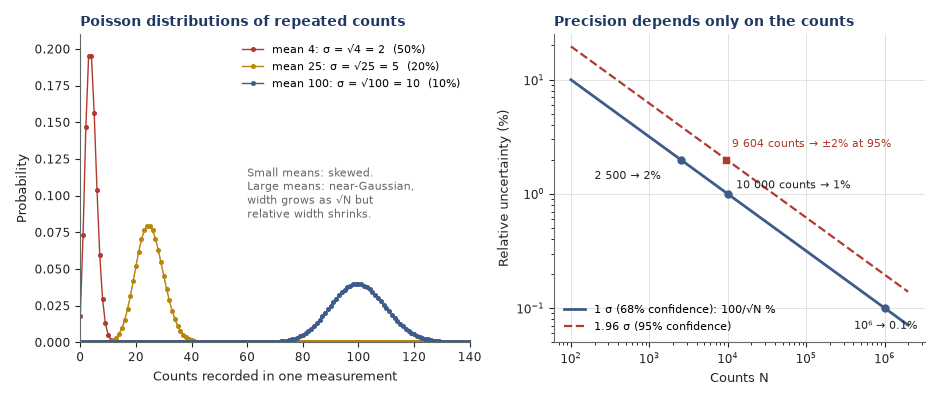
- Relative error 1/√N: 100 counts 10%, 10 000 counts 1%, 10⁶ counts 0.1%.
- ±1σ covers 68.3%, ±1.96σ 95%, ±3σ 99.7% of repeat counts.
- Counts for precision ε at confidence z: N = (z/ε)², e.g. 9 604 for ±2% at 95%.
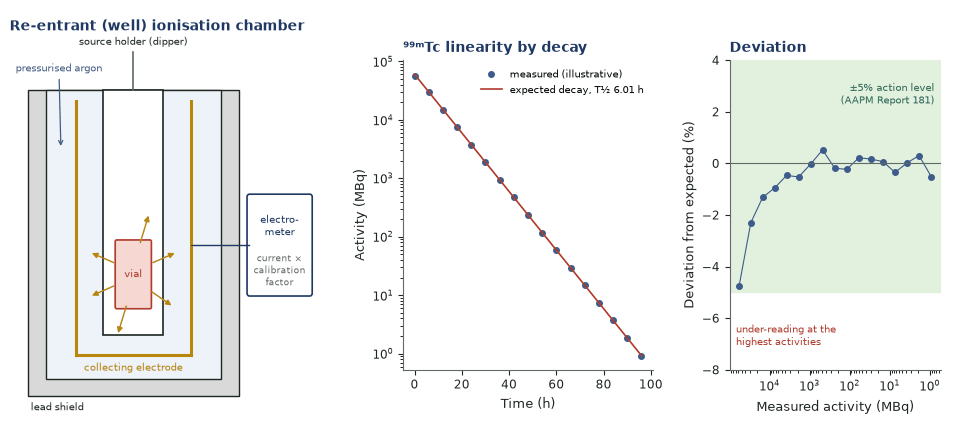
- Calibrator action levels (AAPM Report 181): constancy ±5%, accuracy ±5%, linearity ±5%, reproducibility ±1%.
- ⁹⁹Mo in ⁹⁹ᵐTc: ≤0.15 kBq/MBq at administration (US, 10 CFR 35.204); ≤0.1% of total activity (European/International Pharmacopoeia).
Counts for ±2% at 95% confidence
Given. Thyroid uptake count; net rate 4 000 counts/min; required random error ≤ ±2% at 95%.
- 1.96/√N ≤ 0.02, so √N ≥ 98 and N ≥ 9 604.
- Time = 9 604 / 4 000 ≈ 2.4 min (background neglected).
Answer. About 9 600 counts in 2.4 min.
Net count rate and its uncertainty
Given. Sample 4 900 counts in 2 min; background 1 600 counts in 4 min.
- Gross 2 450 cpm, σ = √4 900 / 2 = 35 cpm.
- Background 400 cpm, σ = √1 600 / 4 = 10 cpm.
- Net 2 050 cpm, σ = √(35² + 10²) = 36 cpm.
Answer. 2 050 ± 36 cpm (1.8%). Subtracting background always adds uncertainty.
Dead-time correction
Given. Gamma camera, paralysable, τ = 1.0 µs, observed 90 000 counts/s.
- Iterate n = m·enτ: 90 000 → 98 470 → 99 310 → 99 400 counts/s.
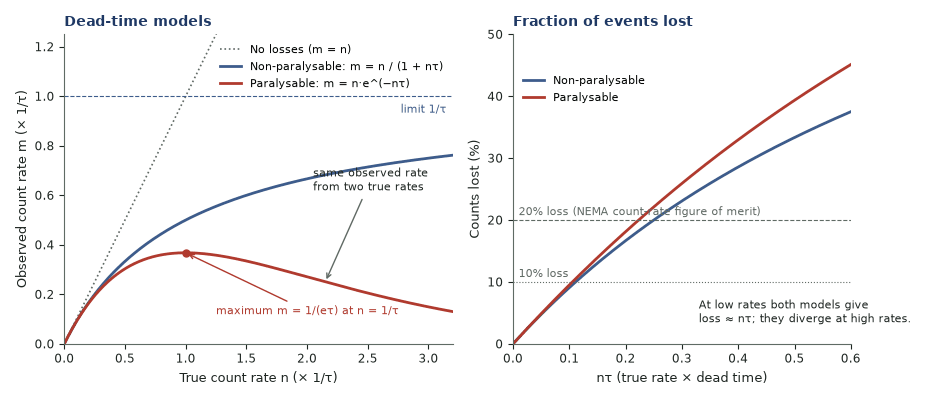
- Loss = 1 − 90 000/99 400 = 9.5%. The non-paralysable model gives 90 000/0.91 = 98 900.
Answer. True rate ≈ 99 400 counts/s; the models diverge only near saturation.
Poisson counting statistics
- Decays are independent, so repeat counts follow a Poisson distribution whose variance equals its mean: σ = √N.
- Precision depends only on the number of counts: 10 000 counts give ±1% (1σ) whether collected in 1 s or 1 h.
- √N applies to raw counts; for a rate, σR = √N/t. Differences add absolute errors in quadrature; ratios add relative errors in quadrature, so an uptake ratio carries the errors of patient, background and standard counts.
Background, counting time and detection limits
- Net-rate uncertainty is √(Ng/tg² + Nb/tb²). For a fixed total time it is smallest when tg/tb = √(Rg/Rb).
- Currie's detection limit for a paired blank is LD = 2.71 + 4.65√B counts (5% false-positive and false-negative rates); dividing by efficiency, time and yield gives the minimum detectable activity for wipe tests and surveys.
Checking counters: chi-square and dead time
- Chi-square test: about 10 repeat counts, χ² = Σ(Ni − N̄)²/N̄ with n − 1 degrees of freedom. For 10 readings 90% of Poisson data fall between 3.3 and 16.9; a high value suggests instability, a very low one a fault suppressing variation.
- Paralysable systems restart the dead time with each event, so the observed rate peaks at 1/(eτ) and then falls: a very hot sample can read like a much weaker one.
- Current gamma cameras lose about 10% at 80 000–100 000 counts/s, which matters mainly for first-pass and high-activity work (AAPM Report 177).
The dose calibrator
- A sealed, pressurised gas (usually argon) chamber surrounds the source in a well; the current, tens of femtoamperes to tens of picoamperes per MBq, is converted to activity by the nuclide's calibration factor (dial setting).
- Every setting gives a reading but only the correct one gives the right activity, and radionuclidic impurities add to the current.
- Calibration factors depend on container, volume and position, so always use the supplied dipper and liner. Very high activities under-read from ion recombination, which linearity testing detects.
- Decay-correct to administration time: 1 hour is an 11% error for ⁹⁹ᵐTc, 30 minutes 17% for ¹⁸F.
Calibrator quality control (AAPM Report 181)
| Test | When | Action level |
|---|---|---|
| Background | Each day of use | Investigate any rise |
| Constancy: check source (e.g. ¹³⁷Cs) on its own and common settings | Each day of use | ±5% |
| Reproducibility: 10 readings | Acceptance, annual | ±1% of mean |
| Accuracy: traceable ⁵⁷Co, ¹³³Ba, ¹³⁷Cs or ⁶⁰Co, >3.7 MBq | Acceptance, annual | ±5% |
| Linearity: decaying source or calibrated shields, down to ~1 MBq | Acceptance, repair, annual | ±5% |
| Geometry and volume | Acceptance | Correction factors |
| Supplier assay agreement | Annual | Investigate >10% |
Regulation and difficult nuclides
- US: 10 CFR 35.60 requires calibration to national standards or the manufacturer's instructions, and 35.63 bars a dosage more than 20% from the prescription unless the authorised user directs. UK/EU: NPL Good Practice Guide 93, EANM QC recommendations and IAEA TRS-454 (±5% accuracy, annual linearity).
- Low-energy emitters (¹²³I, ¹¹¹In, ²⁰¹Tl, ¹³³Xe): a glass-vial setting can over-read a plastic syringe by 20–60% for ¹²³I and 15–30% for ¹¹¹In; a 0.6–1 mm copper insert reduces this.
- ⁹⁰Y is measured through bremsstrahlung, which depends strongly on container and volume, so settings must be geometry-specific and traceable; glass and resin microsphere calibrations disagree by tens of percent against ⁹⁰Y PET.
- ²²³Ra: the 2015 NIST standard revision raised stated values by 10.5% and the label changed from 50 to 55 kBq/kg, with no change in activity actually given.
- ⁹⁹Mo breakthrough is assayed in a lead canister that stops 140 keV but passes 740/778 keV photons. The ratio rises 3.5-fold in 12 h as ⁹⁹ᵐTc decays, so an eluate above 0.043 kBq/MBq fails the US limit within 12 h (generator).
In depth
- Two-source dead time (non-paralysable approximation): τ ≈ (m1 + m2 − m12)/(2m1m2), with each source giving about 10% loss.
- Currie's critical level LC = 2.33√B decides 'detected'; LD is the signal detected 95% of the time.
- The calibrator response–energy curve has a low-energy peak, so abundant X-rays below about 100 keV make readings container-dependent.
- ⁵⁷Co (122 keV, T½ 272 d) stands in for ⁹⁹ᵐTc and ¹³³Ba (356 keV, 10.5 y) for ¹³¹I; ¹³⁷Cs (662 keV, 30.1 y) is the long-term constancy source.
- About 6% of a ⁹⁹ᵐTc dose can remain in the syringe–needle dead volume and wall adsorption can exceed 30%, so residuals are measured for SUV and therapy work.
Sources: Cherry, Sorenson & Phelps, 4th ed. · AAPM Reports 177 and 181 · Currie 1968 · NRC IN 2016-03 · 10 CFR 35
Sources
- Cherry SR, Sorenson JA, Phelps ME. Physics in Nuclear Medicine. 4th ed. Philadelphia: Elsevier Saunders; 2012.
- Carey JE, Byrne P, DeWerd L, et al. AAPM Report No. 181: radionuclide calibrators used in nuclear medicine. College Park, MD: AAPM; 2012.
- Halama JR, Graham D, Harkness BA, et al. AAPM Report No. 177: acceptance testing and annual physics survey for gamma camera, SPECT and SPECT/CT systems. AAPM; 2019.
- IAEA. Quality Assurance for Radioactivity Measurement in Nuclear Medicine. Technical Reports Series No. 454. Vienna: IAEA; 2006.
- Gadd R, Baker M, Nijran KS, et al. Measurement Good Practice Guide No. 93: calibration of medical radionuclide calibrators and their quality control. Teddington: NPL; 2006.
- Busemann Sokole E, Płachcínska A, Britten A, et al. Routine quality control recommendations for nuclear medicine instrumentation. Eur J Nucl Med Mol Imaging. 2010;37:662-71.
- US NRC. 10 CFR Part 35 (§35.60, §35.63, §35.204) and Information Notice 2016-03 (radium-223 standard). 2016.
- Currie LA. Limits for qualitative detection and quantitative determination. Anal Chem. 1968;40:586-93.
- Carlier T, Gnesin S, Mikell JK, et al. Discordance between ⁹⁰Y-PET/CT(MR)-estimated activity and dose calibrator measured administered activity. EJNMMI Phys. 2025;12:12.