Quantification, Attenuation & Scatter Correction
Turning counts into meaningful numbers requires correcting for attenuation and scatter and understanding the SUV and what perturbs it. SUV normalises tumour uptake to injected dose and body size, but is sensitive to uptake time, blood glucose, body habitus, partial-volume effects and reconstruction — so it must be standardised for serial comparison.
Attenuation correction (usually CT-based) restores quantitative accuracy; scatter correction removes mis-positioned counts; partial-volume effects reduce apparent uptake in small lesions. SUV = tissue activity concentration ÷ (injected dose ÷ body weight).
- SUV = C_tissue (kBq/mL) ÷ [net injected activity (MBq) ÷ body weight (kg)], with activity decay-corrected to the scan (or injection) time and syringe residual subtracted.
- SUL uses lean body mass (Janmahasatian): men 9 270 × W/(6 680 + 216 × BMI); women 9 270 × W/(8 780 + 244 × BMI).
- EANM FDG uptake time 60 min (acceptable 55–75 min); repeat studies within 10 min of the baseline interval.
- Glucose-corrected SUV multiplies by plasma glucose/5.0 mmol/L; optional, and reported alongside uncorrected values.
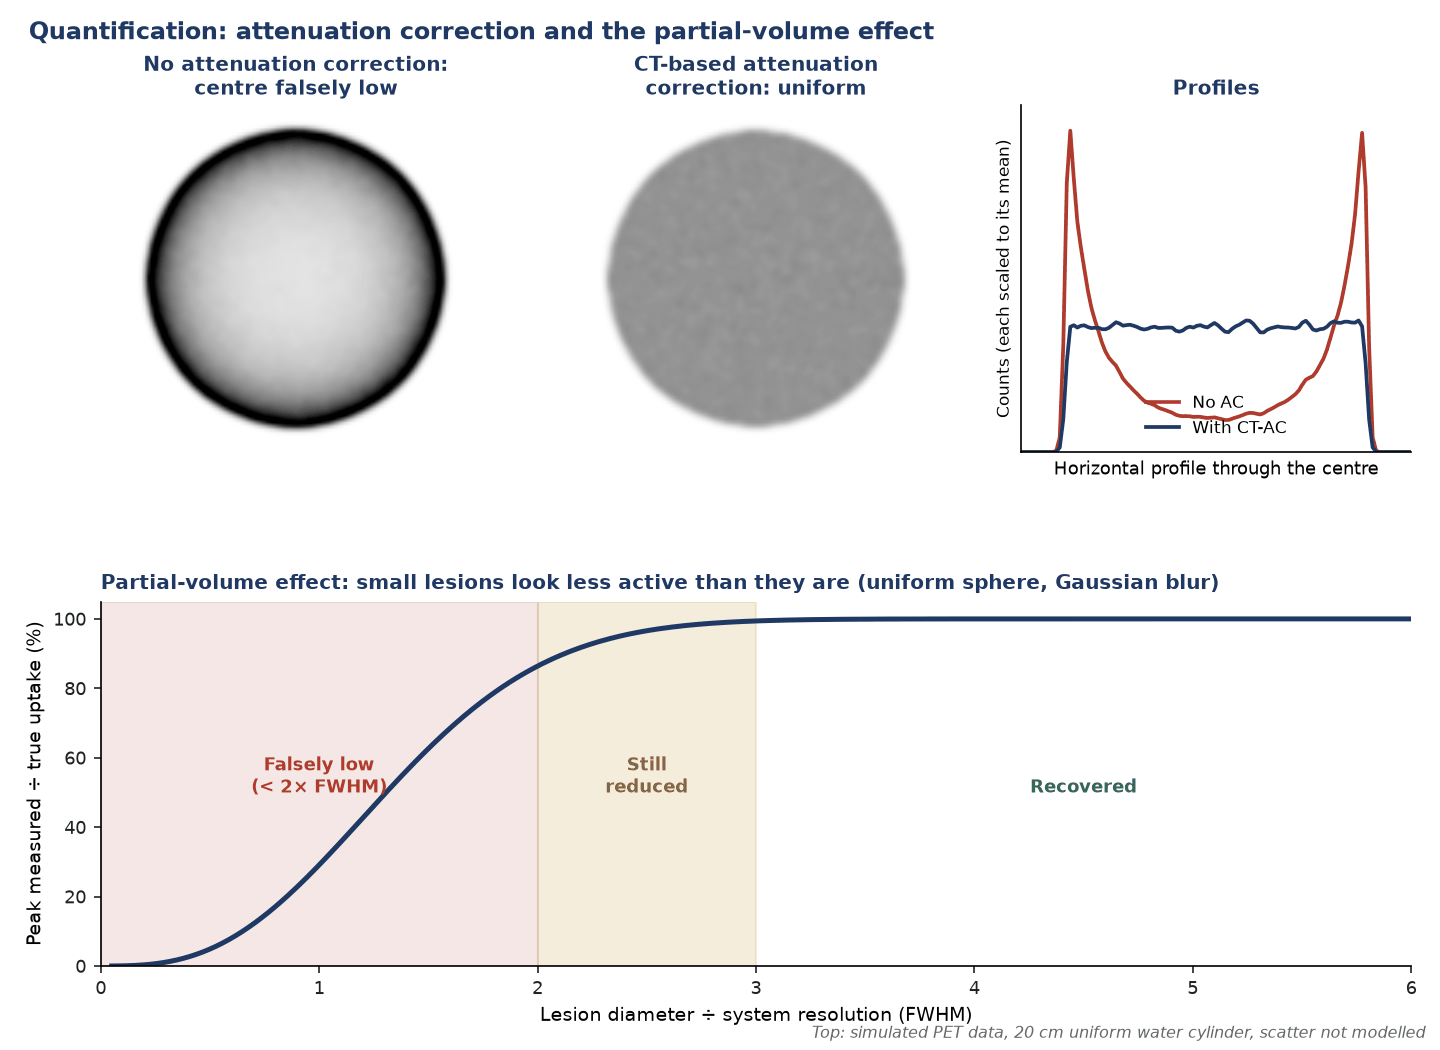
- Partial-volume loss becomes important when an object is smaller than about 2–3 × the FWHM; recovery coefficient = measured/true concentration.
- PERCIST: SULpeak in a 1 cm³ sphere; metabolic response needs a ≥30% fall (and ≥0.8 SUL units).
- CT µ maps at an effective ~70 keV are scaled to 511 keV (PET) or 140 keV (SPECT); randoms scale with activity squared.
- Counting precision is 100/√N % (see counting statistics).
SUV and SUL for an FDG lesion
Given. 370 MBq FDG assayed at 09:00, injected at 09:10; 10 MBq left in the syringe at 09:10. Scan starts 10:10 (images decay-corrected to scan start). Man, 80 kg, 1.75 m. Lesion 12.0 kBq/mL. ¹⁸F T½ 109.8 min.
- Activity at injection: 370 × 2^(−10/109.8) = 347.4 MBq; net = 347.4 − 10 = 337.4 MBq.
- Decay to scan start (60 min): 337.4 × 0.685 = 231.0 MBq.
- SUVbw = 12.0 ÷ (231.0/80) = 12.0 ÷ 2.89 = 4.16.
- BMI = 26.1; LBM = 9 270 × 80/(6 680 + 216 × 26.1) = 60.2 kg; SUL = 12.0 ÷ (231.0/60.2) = 3.13.
Answer. SUVbw 4.2, SUL 3.1. Ignoring the residual would lower SUV by 3%, and using the assay value without decay correction to injection would lower it a further 6%.
Partial-volume recovery
Given. A 10 mm sphere with true concentration 20 kBq/mL; reconstructed image resolution about 8 mm FWHM (Gaussian).
- Peak recovery of a blurred uniform sphere (radius a, σ = FWHM/2.355): RC = erf(a/σ√2) − √(2/π)·(a/σ)·e^(−a²/2σ²).
- a = 5 mm, σ = 3.4 mm: RC = 0.86 − 0.40 = 0.46, so the peak reads about 9.2 kBq/mL.
- A 30 mm sphere gives RC ≈ 1.0.
Answer. A 54% underestimate from size alone: a shrinking lesion can show a falling SUV with no change in metabolism.
Corrections
- Attenuation correction with a CT map is essential for quantitative PET and improves SPECT specificity.
- Scatter correction removes Compton-scattered counts that reduce contrast.
- Partial-volume effect makes lesions smaller than ~2–3× the system resolution (FWHM) appear falsely low.
Factors affecting SUV
- Uptake time (longer post-injection → higher tumour SUV) — standardise (~60 min for FDG).
- Blood glucose (hyperglycaemia competes with FDG, lowering tumour SUV).
- Body habitus — use lean-body-mass (SUL) in large patients.
- ROI/VOI method, reconstruction parameters, motion, and dose extravasation all shift SUV.
Good practice
- Keep uptake time, glucose control, scanner and reconstruction constant for follow-up scans.
- Report SUVmax with the method used; consider SUVpeak/SUL for robustness.
- Cross-calibrate the scanner and dose calibrator regularly.
Pitfalls
- Comparing SUVs across scanners/protocols without harmonisation is unreliable.
- Inflammation, brown fat and muscle raise FDG SUV (false positives).
- Extravasated dose lowers all SUVs — inspect the injection site.
In the clinic — why the physics matters
- SUV tracks tumour metabolism for response assessment, but only if uptake time, glucose, scanner and reconstruction are kept constant.
- Scatter adds a low-frequency background and lowers contrast; model-based scatter correction is required for reliable SUV.
- Contrast, metal and respiratory mismatch bias CT attenuation maps and hence SUV near the diaphragm, heart and implants.
- SUVmax is biased upwards by noise, more so with short scans, many iterations and no smoothing; SUVpeak is more robust.
True, scattered and random coincidences
| Type | Origin | Activity dependence | Correction |
|---|---|---|---|
| True | Both photons unscattered, correct line of response | ∝ activity | Signal |
| Scatter | One or both photons Compton-scattered but still in the window | ∝ activity; rises with patient size | Energy window, model-based (single-scatter simulation) subtraction |
| Random | Two photons from different annihilations within the timing window | ∝ activity² | Delayed-window or singles-based estimate; shorter timing window |
Common pitfalls & misconceptions
- SUV is semiquantitative, not absolute — it depends on uptake time, glucose, ROI, and partial-volume effect.
- Precision ≠ accuracy — tight reproducibility can still be systematically wrong.
- Randoms don't scale linearly with dose — they grow as activity².
- Partial-volume works both ways — spill-out lowers apparent activity in small hot lesions; spill-in raises it in cold spots.
In depth
- Every term in the SUV carries error: dose calibrator accuracy, residual activity, clock offsets between calibrator, injection and scanner, and patient weight. Kinahan and Fletcher estimate that unmanaged sources combined can alter SUV by tens of percent.
- Cross-calibration of scanner and dose calibrator: a uniform phantom should give SUV 1.0 within ±10% (AAPM TG-126); EANM advises checking at least quarterly and after hardware or software changes.
- Harmonisation (EARL): recovery coefficients measured in the NEMA IEC phantom must lie within set bands; updated EARL2 bands allow the higher recovery of PSF and TOF reconstructions (Kaalep 2018).
- Partial-volume effect has two parts: spill-out from a small hot object (underestimation) and spill-in from hot neighbours (overestimation of cold regions). Correction by recovery coefficients works only for simple, isolated shapes.
- Noise raises SUVmax: the maximum of noisy voxels is biased upwards, while SUVmean depends heavily on how the VOI is drawn (Boellaard 2004).
- PERCIST uses the liver (3 cm ROI) as a reference and a 1 cm³ SULpeak VOI in the hottest tumour region; test–retest studies show changes of about 20% can occur by chance, hence the 30% response threshold.
- Glucose normalisation assumes tightly regulated glucose metabolism; EANM notes no clear evidence that it improves response assessment, so values are given with and without correction.
- CT-based attenuation correction scales each voxel's CT number with separate slopes for soft tissue and bone; dense oral or intravenous contrast is misread as bone and slightly over-corrected.
Sources: EANM FDG guideline v2.0 (PMID 25452219) · Wahl et al. 2009 PERCIST (PMID 19403881) · Kinahan & Fletcher 2010 (PMID 21147377) · Boellaard 2004 (PMID 15347719) · Kaalep 2018 (PMID 29500480) · Soret 2007 (PMID 17504879) · AAPM Report 126
Sources
- Boellaard R, Delgado-Bolton R, Oyen WJ, et al. FDG PET/CT: EANM procedure guidelines for tumour imaging: version 2.0. Eur J Nucl Med Mol Imaging. 2015;42:328-54.
- Wahl RL, Jacene H, Kasamon Y, Lodge MA. From RECIST to PERCIST: evolving considerations for PET response criteria in solid tumors. J Nucl Med. 2009;50(Suppl 1):122S-50S.
- Kinahan PE, Fletcher JW. Positron emission tomography-computed tomography standardized uptake values in clinical practice and assessing response to therapy. Semin Ultrasound CT MR. 2010;31:496-505.
- Soret M, Bacharach SL, Buvat I. Partial-volume effect in PET tumor imaging. J Nucl Med. 2007;48:932-45.
- Boellaard R, Krak NC, Hoekstra OS, Lammertsma AA. Effects of noise, image resolution, and ROI definition on the accuracy of standard uptake values: a simulation study. J Nucl Med. 2004;45:1519-27.
- Janmahasatian S, Duffull SB, Ash S, et al. Quantification of lean bodyweight. Clin Pharmacokinet. 2005;44:1051-65.
- Kaalep A, Sera T, Rijnsdorp S, et al. Feasibility of state of the art PET/CT systems performance harmonisation. Eur J Nucl Med Mol Imaging. 2018;45:1344-61.
- Kinahan PE, Townsend DW, Beyer T, Sashin D. Attenuation correction for a combined 3D PET/CT scanner. Med Phys. 1998;25:2046-53.
- Mawlawi OR, Kemp BJ, Jordan DW, et al. AAPM Report No. 126: PET/CT acceptance testing and quality assurance. College Park, MD: AAPM; 2019.