Internal Dosimetry: MIRD and Therapy Dosimetry
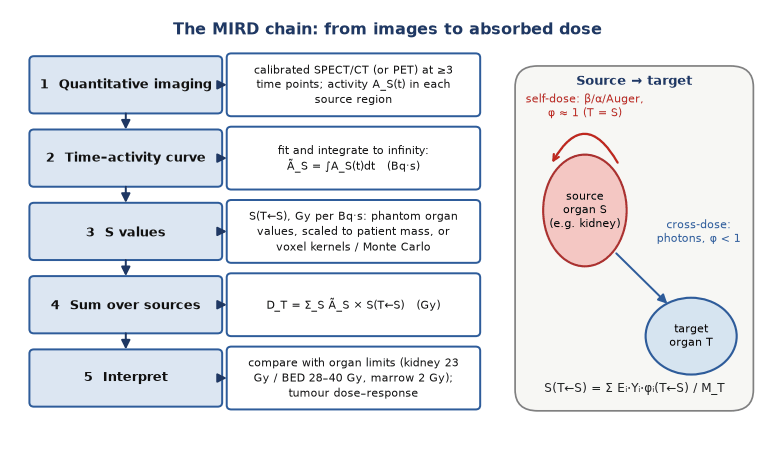
Internal dosimetry turns where activity goes, and for how long, into absorbed dose. The MIRD schema multiplies the number of decays in each source region (time-integrated activity, Ã) by an S value, the dose to a target per decay. Diagnostic studies are summarised by effective dose in reference phantoms; therapy needs patient-specific absorbed doses from quantitative SPECT/CT at several time points.
Absorbed dose (Gy = J/kg) predicts tissue reactions such as renal or marrow toxicity and tumour response. Effective dose (Sv) is a protection quantity for a reference person: it compares procedures but does not describe an individual patient.
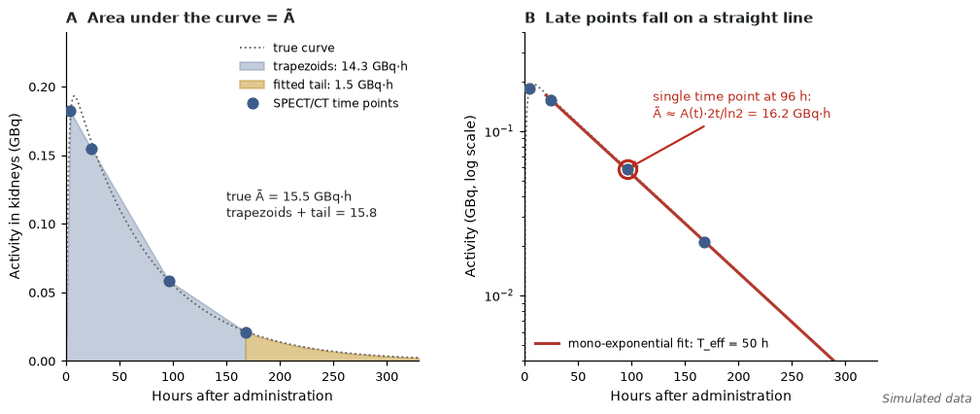
- à = ∫A(t)dt (Bq·s); for mono-exponential clearance à = f·A₀/λ_eff = 1.443·f·A₀·T_eff.
- Time-integrated activity coefficient ã = Ã/A₀ — the MIRD 21 name for residence time.
- S(T←S) = (1/M_T)·Σ Eᵢ·Yᵢ·φᵢ(T←S), in Gy per Bq·s; independent of activity.
- ICRP 103 w_T: 0.12 red marrow, colon, lung, stomach, breast, remainder; 0.08 gonads; 0.04 bladder, oesophagus, liver, thyroid; 0.01 bone surface, brain, salivary glands, skin.
- ¹⁸F-FDG adult dose coefficient 0.019 mSv/MBq (ICRP 128): about 7 mSv for 370 MBq.
- ⁹⁰Y: D (Gy) ≈ 50 × A (GBq) / M (kg) with complete local absorption.
- ¹⁷⁷Lu-PRRT kidneys 23 Gy, or BED 28 Gy (risk factors) / 40 Gy (none); marrow 2 Gy.
- ¹³¹I: blood ≤2 Gy; Graves' disease 150 Gy (euthyroid aim) to 200–300 Gy (ablative); toxic nodule 300–400 Gy.
Kidney dose from mono-exponential clearance
Given. ¹⁷⁷Lu-DOTATATE 7.4 GBq. Kidneys (300 g) take up f = 3% promptly and clear with T_eff = 50 h. Electron energy ≈ 0.147 MeV per decay, fully absorbed; photon cross-dose neglected.
- Ã = f·A₀·T_eff/ln2 = 2.22×10⁸ Bq × (50 × 3600 s)/0.693 = 5.77×10¹³ Bq·s.
- S = 0.147 × 1.602×10⁻¹³ J / 0.30 kg = 7.85×10⁻¹⁴ Gy per Bq·s.
- D = Ã × S = 4.5 Gy per cycle (0.61 Gy/GBq); four cycles ≈ 18 Gy.
- Single-time-point check: A(96 h) = 0.0587 GBq; A(t)·2t/ln2 = 5.85×10¹³ Bq·s (+1.5%).
Answer. About 4.5 Gy per cycle and 18 Gy after four — below the 23-Gy constraint if the kinetics stay the same.
The MIRD schema
- Dose to a target is the sum over source regions of Ã × S: D(r_T) = Σ Ã(r_S)·S(r_T←r_S).
- S values come from Monte Carlo transport in reference phantoms, using each nuclide's emission energies and yields and the absorbed fraction φ reaching the target.
- For β, α and Auger emitters φ ≈ 1 within the source and ≈ 0 elsewhere, so self-dose dominates; photons add cross-dose between organs.
- Organ S values assume uniform activity in reference-mass organs; scaling self-dose by reference/patient mass is the simplest personalisation.
Effective dose and its limits
- E = Σ w_T·H_T, with H_T = Σ w_R·D_T,R (w_R 1 for photons and electrons, 20 for α).
- ICRP 128 tabulates dose coefficients for reference adults and children; effective dose serves justification, optimisation and comparison of procedures, not an individual's dose or risk.
- Therapy causes tissue reactions that depend on organ absorbed dose and dose rate, so effective dose has no role there (see radiation protection).
Software and voxel methods
- OLINDA/EXM and IDAC-Dose 2.1 (ICRP voxel phantoms, sphere module for tumours) calculate organ doses from organ à values.
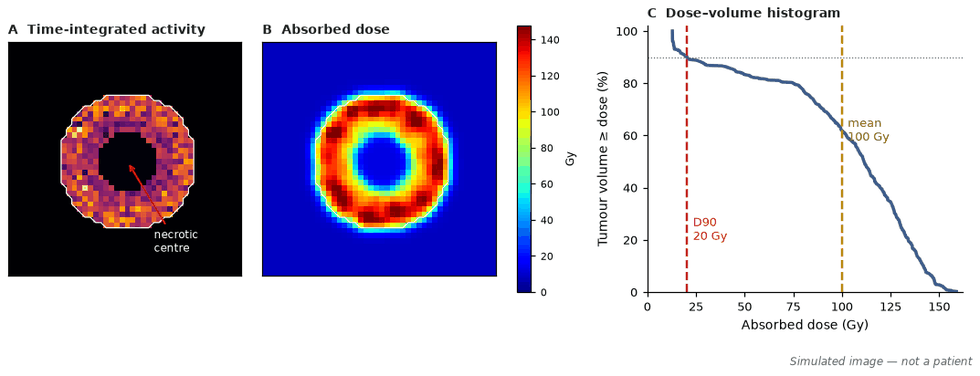
- Voxel dosimetry convolves the 3-D Ã map with voxel S values or dose-point kernels, or assumes local deposition when the β range is shorter than the voxel (¹⁷⁷Lu about 2 mm maximum vs 4–5 mm voxels).
- Monte Carlo on the patient's CT handles lung and bone interfaces; voxel methods yield dose maps and dose–volume histograms that reveal heterogeneity.
Quantitative SPECT/CT and time points
- Quantification needs attenuation, scatter and resolution modelling, a phantom-derived calibration factor (cps/MBq), dead-time correction and recovery coefficients for small objects (see quantification).
- Use at least three well-separated time points; for kidneys after the first ¹⁷⁷Lu cycle EANM advises three SPECT/CT scans between day 1 and day 7.
- Fit the curve and integrate to infinity — trapezoids alone miss the tail; single-time-point methods rely on known population kinetics.
Therapy dosimetry in practice
- ¹³¹I thyroid cancer: blood ≤2 Gy and 48-h whole-body retention ≤4.44 GBq (≤2.96 GBq with diffuse lung metastases); ablation succeeded more often with ≥300 Gy to remnants and ≥80 Gy to metastases (see thyroid cancer).
- Benign thyroid (Marinelli-type): activity = target dose × mass / (energy per decay × time-integrated uptake); EANM rule of thumb (T_eff 5.5 d) is 6, 8 or 12 MBq × mass (g) / 24-h uptake for 150, 200 or 300 Gy.
- ¹⁷⁷Lu-DOTATATE: kidneys and marrow are the organs at risk; ¹⁷⁷Lu-PSMA: salivary and lacrimal glands and marrow, with no established salivary tolerance dose (see theranostics).
- ⁹⁰Y SIRT partition model from ⁹⁹ᵐTc-MAA SPECT/CT: lung ≤30 Gy per treatment and ≤50 Gy cumulative; resin whole-liver: non-tumoural liver ≤40 Gy, tumour ≥100–120 Gy.
- EU: Directive 2013/59/Euratom Article 56 requires therapy to be individually planned and its delivery verified. US: NRC requires a written directive for therapeutic administrations but not patient-specific dosimetry.
- BED for instantaneous uptake and mono-exponential clearance: BED = D[1 + D·λ/((μ + λ)·α/β)], μ = repair rate, λ = clearance rate.
In depth
- MIRD 21 replaced 'cumulated activity' and 'residence time' by à and ã, and adopted effective dose only for comparing stochastic risk.
- Models differ: IDAC-Dose 2.1 with ICRP 103 weighting gives 0.016 mSv/MBq for FDG, against 0.019 mSv/MBq in ICRP 128.
- Single time point: a kidney measurement at about 96 h reproduced à with median error +5% (−9 to +17%); 24-, 48- and 144-h measurements underestimated kidney dose unacceptably in some patients.
- Kidney doses are 0.54–1.00 Gy/GBq for ¹⁷⁷Lu-somatostatin analogues and 0.4–0.8 Gy/GBq for ¹⁷⁷Lu-PSMA, with up to three-fold spread between patients.
- EANM reads Article 56 in three levels: standardised treatments within 10% of the intended activity; off-label activities more than 25% above label need patient-specific organ-at-risk dosimetry; dosimetry-guided prescription.
- In DOSISPHERE-01 (glass ⁹⁰Y, HCC), ≥205 Gy to the index lesion gave a 71% response rate against 36% with 120 ± 20 Gy to the lobe.
Sources: MIRD 21 (PMID 19258258) · Andersson 2017 (PMID 29098485) · Hänscheid 2018 (PMID 28588150) · EANM 2022 (PMID 35284969) · Konijnenberg 2021 (PMID 33057773) · Garin 2021 (PMID 33166497)
Sources
- Bolch WE, Eckerman KF, Sgouros G, Thomas SR. MIRD pamphlet No. 21: a generalized schema for radiopharmaceutical dosimetry. J Nucl Med. 2009;50:477–84.
- ICRP Publication 103: the 2007 Recommendations. Ann ICRP. 2007;37(2–4).
- ICRP Publication 128: radiation dose to patients from radiopharmaceuticals. Ann ICRP. 2015;44(2S).
- Andersson M, et al. IDAC-Dose 2.1, an internal dosimetry program for diagnostic nuclear medicine. EJNMMI Res. 2017;7:88.
- Ljungberg M, et al. MIRD pamphlet No. 26: quantitative ¹⁷⁷Lu SPECT for dosimetry. J Nucl Med. 2016;57:151–62.
- Sjögreen Gleisner K, et al. EANM dosimetry committee recommendations for ¹⁷⁷Lu-labelled SSTR and PSMA ligands. Eur J Nucl Med Mol Imaging. 2022;49:1778–1809.
- Campennì A, et al. The EANM guideline on radioiodine therapy of benign thyroid disease. Eur J Nucl Med Mol Imaging. 2023;50:3324–48.
- Levillain H, et al. International recommendations for personalised SIRT with ⁹⁰Y resin microspheres. Eur J Nucl Med Mol Imaging. 2021;48:1570–84.