FDG Brain PET in Dementia
FDG PET maps cerebral glucose metabolism and shows disease-specific hypometabolism patterns that help subtype dementia when clinical assessment is uncertain. In a pathologically verified series its sensitivity was ≈94% for both Alzheimer’s disease and any neurodegenerative disease, with lower specificity (≈73% and ≈78%, respectively); it is especially useful for separating Alzheimer’s disease from frontotemporal dementia. FDG PET is also a key tool in epilepsy localisation.
Synaptic dysfunction reduces regional glucose use before marked atrophy appears, so FDG PET can reveal a neurodegenerative pattern early. Each major dementia has a characteristic metabolic signature, which is the basis of pattern-based interpretation.
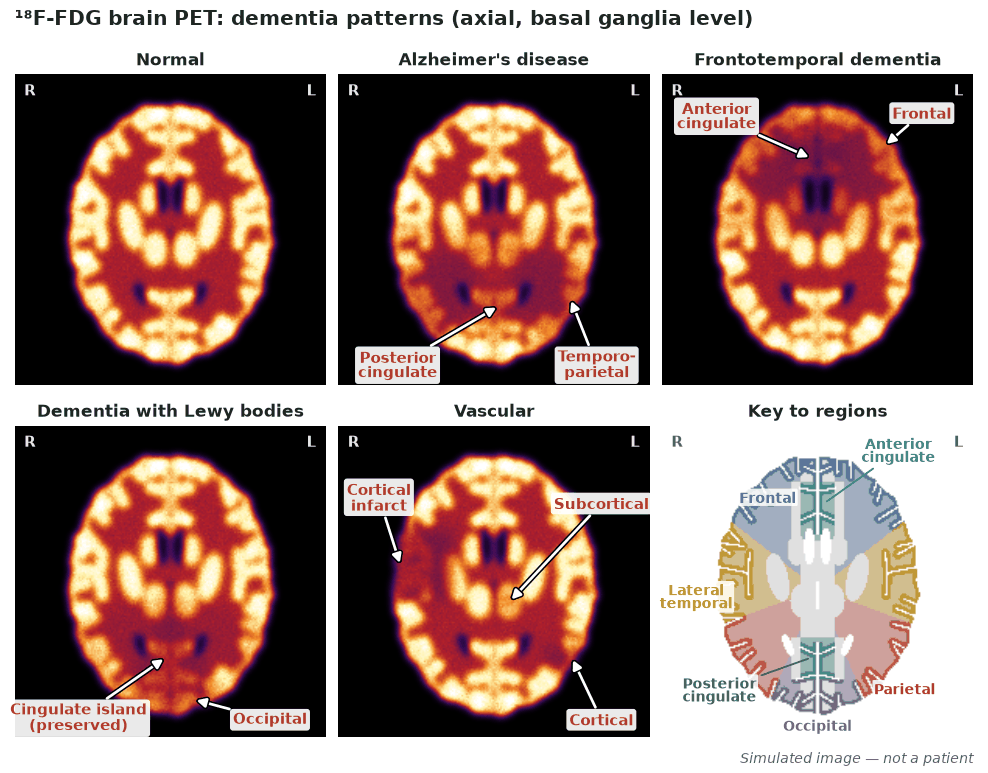
Metabolic patterns
| Dementia | FDG pattern |
|---|---|
| Alzheimer’s disease | Temporoparietal + posterior cingulate/precuneus hypometabolism |
| Frontotemporal dementia | Frontal ± anterior temporal hypometabolism |
| Dementia with Lewy bodies | Occipital hypometabolism (± cingulate island sign) |
| Vascular | Scattered cortical/subcortical defects in vascular territories |
When to image
- Distinguishing Alzheimer’s from frontotemporal dementia when clinical features are equivocal.
- Supporting an early or atypical dementia diagnosis.
- Identifying a neurodegenerative pattern in mild cognitive impairment.
- Epilepsy localisation (interictal hypometabolism).
Protocol
- Fasting (≥4 h) with blood glucose checked — postpone if >160 mg/dL (8.9 mmol/L); uptake in a quiet, dimly lit room with a consistent eyes-open or eyes-closed routine.
- Static acquisition (typically 10–15 min) starting at a fixed time 30–60 min after injection.
- Use statistical surface/z-score maps to support visual reading.
How to read it
- Recognise the disease-specific pattern rather than focal lesions.
- Posterior cingulate/precuneus involvement is an early Alzheimer clue.
- The cingulate island sign (relative posterior-cingulate sparing) favours DLB over AD.
- Correlate with MRI, clinical picture and, where needed, amyloid PET.
Diagnostic performance
In a pathologically verified series (n=138) FDG PET had sensitivity ≈94% for both Alzheimer’s disease and any neurodegenerative disease, with specificity ≈73% and ≈78%, respectively; accuracy for separating Alzheimer’s from frontotemporal dementia is high with pattern-based reading.
Pitfalls
- Patterns overlap early and in mixed pathology.
- Sedation, inconsistent eye state (eye closure lowers occipital uptake) and hyperglycaemia alter cortical uptake.
- FDG shows a pattern, not a molecular diagnosis — pair with amyloid where the question is Alzheimer biology.
Evidence & guidelines
- Silverman et al. (JAMA, 2001; pathology-verified subset): sensitivity ≈94%, with specificity ≈73% for Alzheimer’s disease and ≈78% for any neurodegenerative disease.
- EANM procedure guidelines for brain FDG PET (Guedj et al., 2022, version 3) cover acquisition and interpretation.
- FDG PET is complementary to amyloid/tau PET, which address the underlying molecular pathology.
In depth
- [¹⁸F]FDG uptake reflects neuronal and synaptic activity, so FDG-PET is a sensitive, non-specific marker of neurodegeneration that often shows dysfunction before atrophy is visible on MRI.
- Alzheimer's disease shows bilateral temporoparietal, posterior cingulate and precuneus hypometabolism, whereas frontotemporal lobar degeneration shows frontal and/or anterior temporal hypometabolism depending on subtype.
- In parkinsonism, FDG-PET separates Parkinson’s disease (no major glucose deficit) from atypical parkinsonian syndromes (major deficits), and is reported superior to [¹²³I]IBZM SPECT for this.
- Disease-specific patterns include caudate and striatal hypometabolism in Huntington's disease, motor and premotor cortical hypometabolism (sometimes extending frontally) in ALS, and patchy cortical and subcortical hypometabolism in Creutzfeldt-Jakob disease.
- Logopenic variant primary progressive aphasia shows left-predominant temporoparietal hypometabolism, a pattern that supports underlying Alzheimer pathology rather than FTLD.
- In PSP, FDG-PET shows hypometabolism of the medial frontal cortex (anterior cingulate and supplementary motor area), caudate, thalamus and midbrain, whereas typical Parkinson's disease shows no such deficits.
- Metabolic maps use voxelwise z-score comparison against a normal database, and support-vector-machine classification of combined FDG-PET+MRI improves AD-vs-FTLD differentiation.
Sources: EANM brain FDG PET guideline v3 (PMID 34882261) · PMID 22914831 (Hellwig 2012, Neurology) · PMID 22914831 · PMID 21448435 (Dukart 2011)